MobiMeter® use in on-demand traffic
Mobility survey in the district of Offenbach
Smartphone-based mobility surveys have advantages over conventional methods, which have been proven several times in scientific publications. Just like MobiMeter®: the tracking app automatically records all routes and fully records mobility patterns.
These cannot simply be represented cartographically. Even short distances and footpath stages within intermodal route chains are completely and reliably recorded with MobiMeter®. These are usually underrepresented in classic mobility surveys - because they are often forgotten when noting down one's own mobility behavior by hand or are not recorded due to their apparent insignificance.
The situation is similar regarding the recording of route combinations. In demand-oriented traffic, which is characterized by high flexibility and multimodality in everyday life, short distances and frequent changes of means of transport are the order of the day - as is the case in the region around Frankfurt am Main/Offenbach in Germany. The survey on demand-oriented transport started here in the second half of 2021: the task of MobiMeter® was to analyze the integration of the “Hopper” on-demand taxi service into regional mobility activities.
The key data
Period of the survey: 01.09.2021 – 31.12.2021 (122 days)
Scope of the survey: 83 participants recorded 8,974 routes over a total length of 113,943 km. On average, each participant recorded 38 days in the survey period.
Matrix of traffic relationsMobility in the survey area (all means of transport): Hopper in relation to other means of transport - routes aggregated by municipality |
|
|
|
Interdependence map generated automatically from raw data. The survey was spatially limited to the district of Offenbach in Hesse, Germany. To make the real everyday mobility visible, some of the surrounding municipalities in Hesse and Bavaria can also be seen in the interdependencies in the study area. |
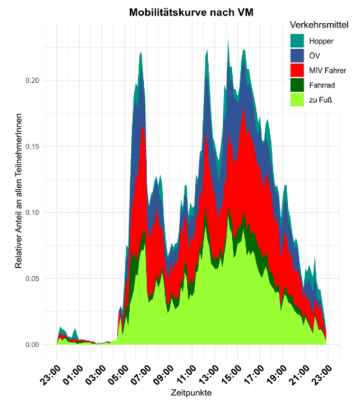
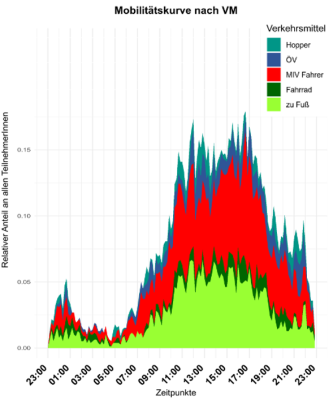
Comparison of mobility curves: means of transport, weekdays versus Saturdays, Sundays and public holidaysAll types of traffic, all people |
||
|
|
|
|
|
Reading example: On weekdays at 6:30 a.m., around 24% of the daily profiles show out-of-home mobility. In almost 10% of the daily profiles, people were out and about on weekdays at 2:00 p.m. |
||
| Mobility curves automatically generated from raw data. | ||
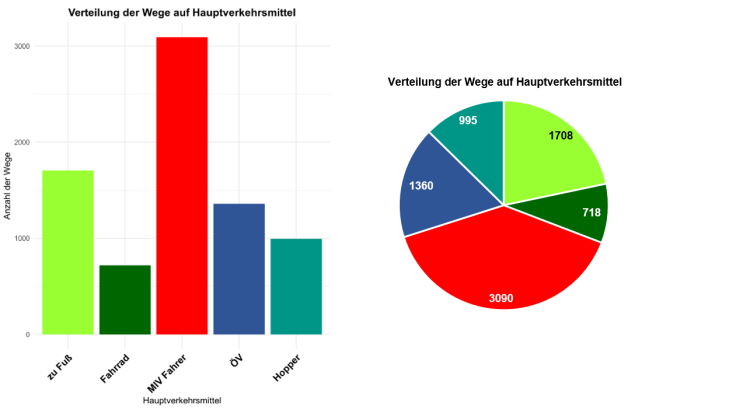
Distribution of the routes to the main means of transportAll people, all modes of transport: stages covered with hoppers in relation to stages covered with other modes of transport. |
||
|
Interpretation example: During the survey period, a total of 1708 trips were made on foot from Monday to Sunday. |
||
|
Charts automatically generated from raw data. |
MobiMeter® was developed and supported by:


