Mobility survey in central Styria
Mobility survey in central Styria
In the second half of 2020, the Graz Urban Mobility Lab carried out a pilot survey in central Styria. In cooperation with the market Institute and Graz University of Technology, PRISMA proved that the acquisition of mobility data - even over several months - with MobiMeter® is easy and effortless for the participants. The initiative is a pilot survey, which is why the results are not representative of the population as a whole.
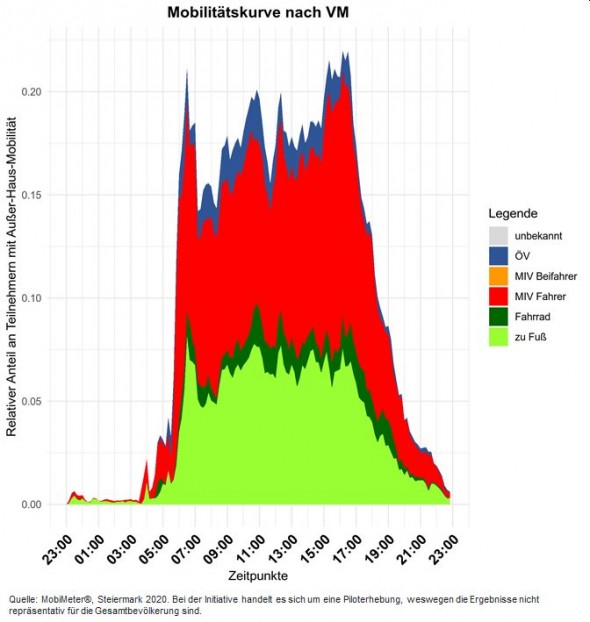
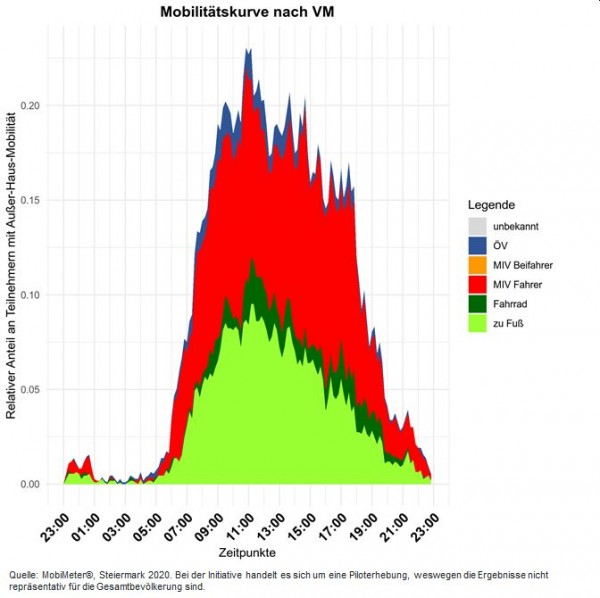
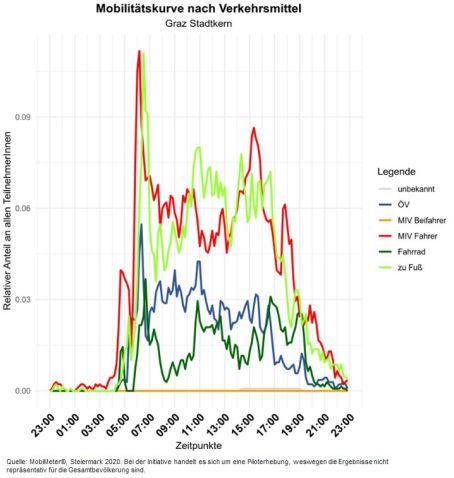
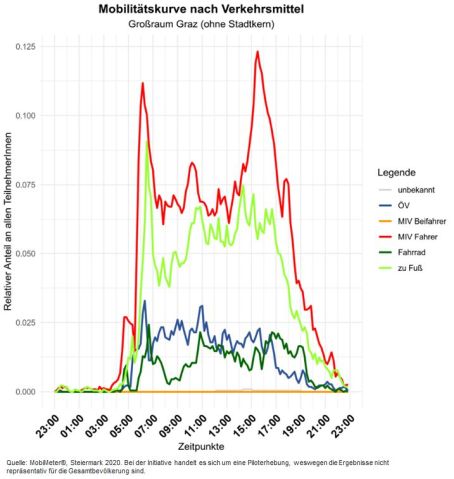
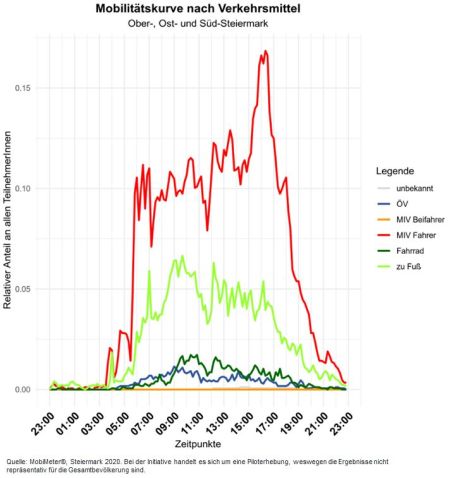
A longitudinal section of data shows changes in mobility behavior over time and thus allows more in-depth statements than the snapshot of a conventional survey.
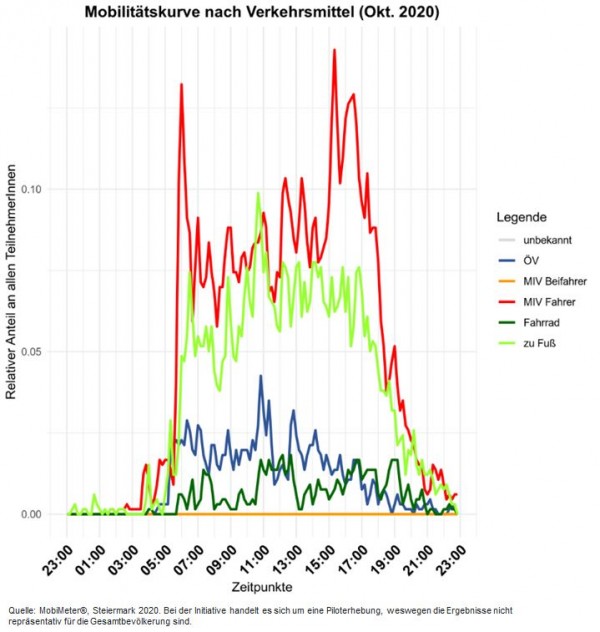
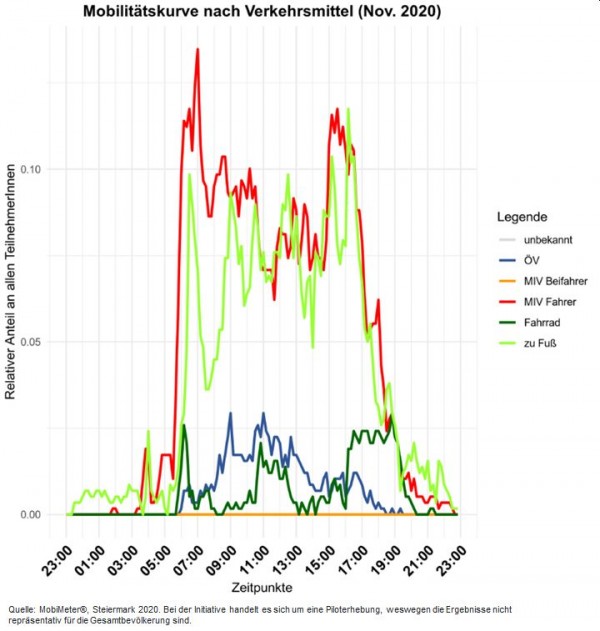
The evaluation of available data is even more interesting, as the second COVID-19 lockdown (Nov. 3 - Dec. 7, 2020) occurred during the survey period.
The key data
Development partner: Mobility Lab Graz
Period: 13.07.2020 – 15.12.2020
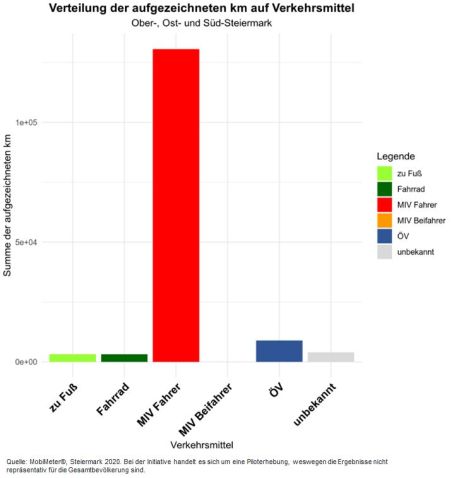
Scope: 85 participants tracked 13.464 routes, either entirely or partially in Styria, with a total length of 183.003 km.
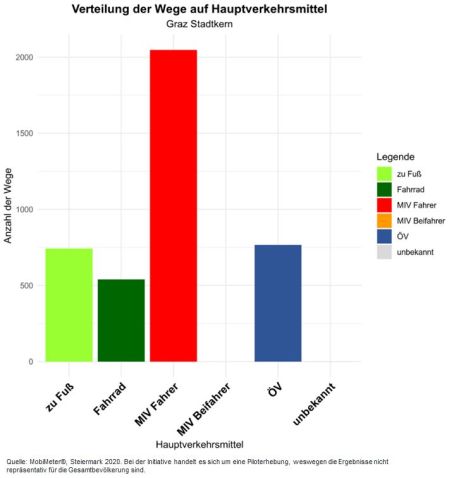
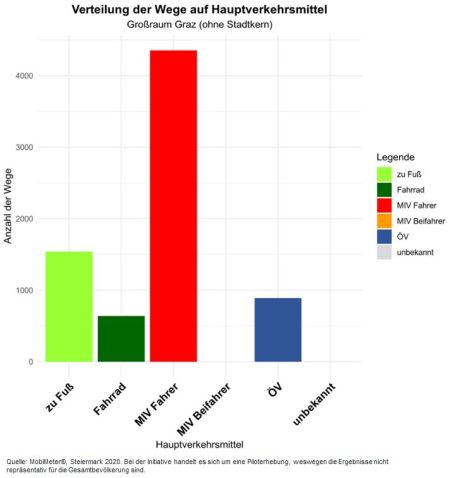
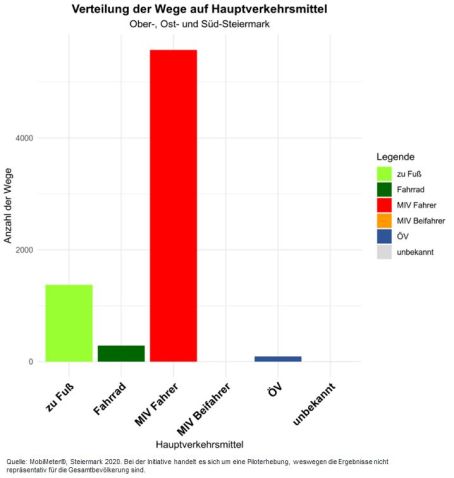
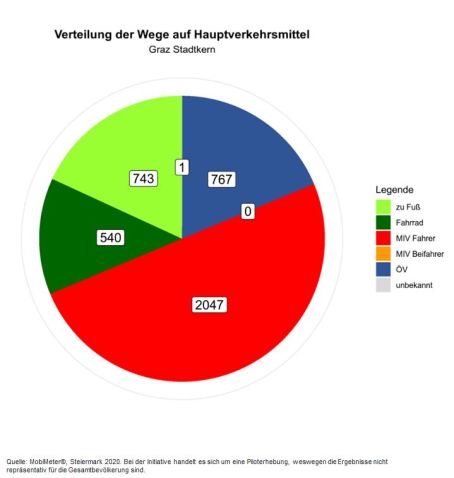
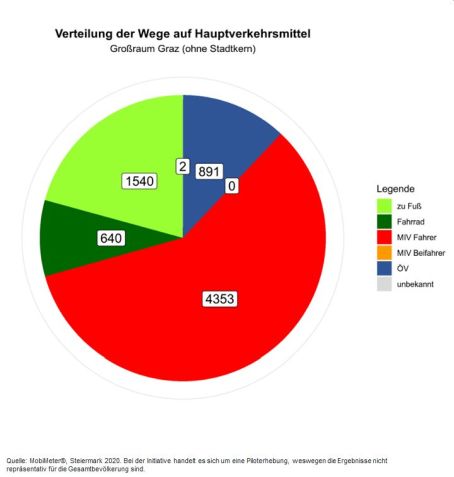
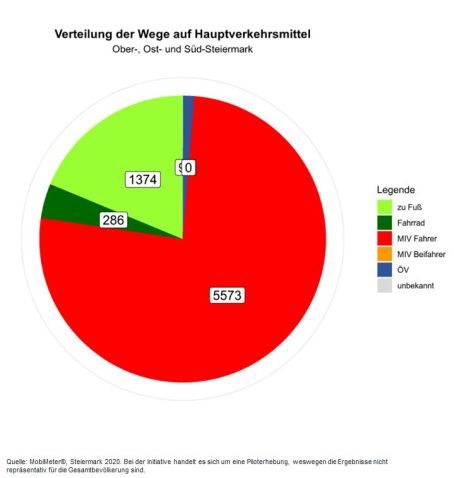
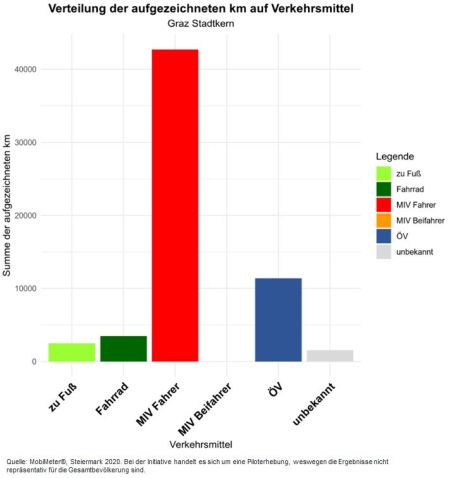
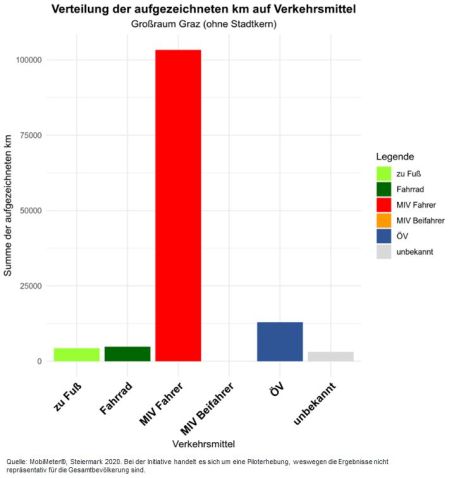
For the evaluation, Styria was divided into three structurally different areas: Graz city center, Greater Graz (excluding the city center) and Upper, Eastern & Southern Styria (excluding Greater Graz).
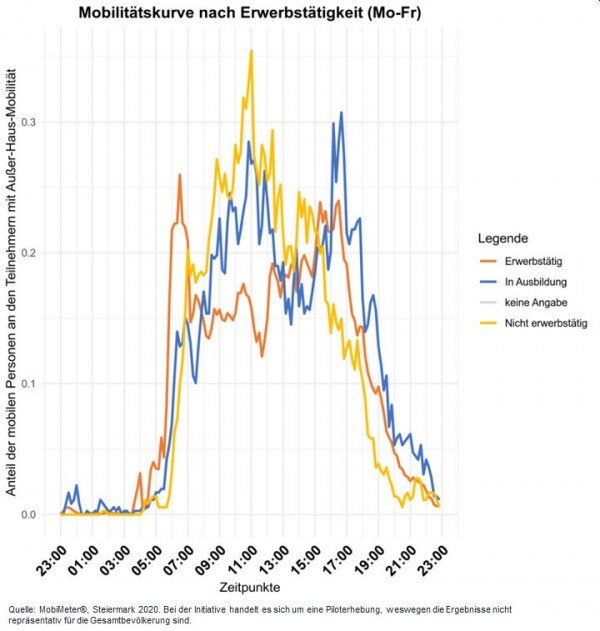
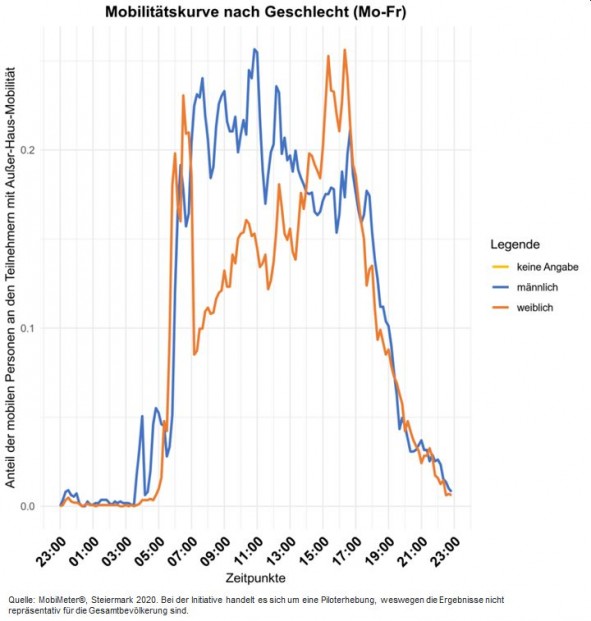
Comparisons of mobility curves
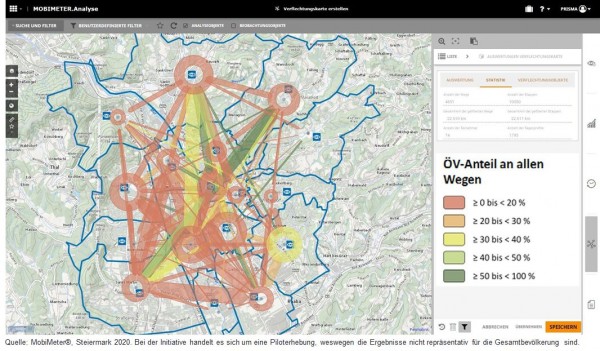
Matrix of traffic relations |
|
|
|
Interconnection map, automatically generated from raw data. |
MobiMeter® was developed and supported by: